Tracking the U.S. economy after the yield curve inverts
Using the NBER 6 monthly indicators
A yield curve inversion sounds the alert that the U.S. economy is headed for recession. Since 1968, there have been 8 episodes in which the 3-month Treasury rate has exceeded the 10-year rate. A recession has ensued in every one of those cases, but at no other times. The lags from the first inversion month to the start of the recession have varied from 6 to 17 months. For these reasons, after the yield curve inverts for a full month, it makes sense to track the economy, looking closely at timely data to try to identify the start of the recession in real time.
The business cycle dating committee of the National Bureau of Economic Research (NBER) is recognized as the authority on the dating of recessions in the U.S. economy. They identify the peak month of the business cycle, after which the recession starts, and the trough month, when the recession ends. The committee lists 6 monthly variables that they follow in real time for these purposes, namely, "real personal income less transfers (PILT), nonfarm payroll employment, real personal consumption expenditures, wholesale-retail sales adjusted for price changes, employment as measured by the household survey, and industrial production." They add the caveat that "there is no fixed rule about what measures contribute information to the process or how they are weighted in our decisions."
The first two sets of graphs below track each of the NBER 6 indicators from the time the yield curve first inverted in November 2022. A common pitfall is to assume that the series will decline soon after the yield curve first inverts, but in fact the lags are fairly long. To put the data in context, the current path is compared with the trajectory followed by the indicator over the 8 inversion periods from 1968 to 2020, each of which led to a recession. Set 1 shows the individual paths of the variable over each of the 8 inversions periods and into the subsequent recession. To consolidate the data from the earlier inversion periods, Set 2 compares the current track with summary statistics for 7 of the pre-recession inversion periods.
The third set of graphs illustrates the behavior of the NBER 6 during recessions. It shows each variable indexed to the business cycle peak and traces its path up to the cyclical trough. In this case, the graphs include the 6 recessions since 1978, when the current NBER cycle dating committee was created.
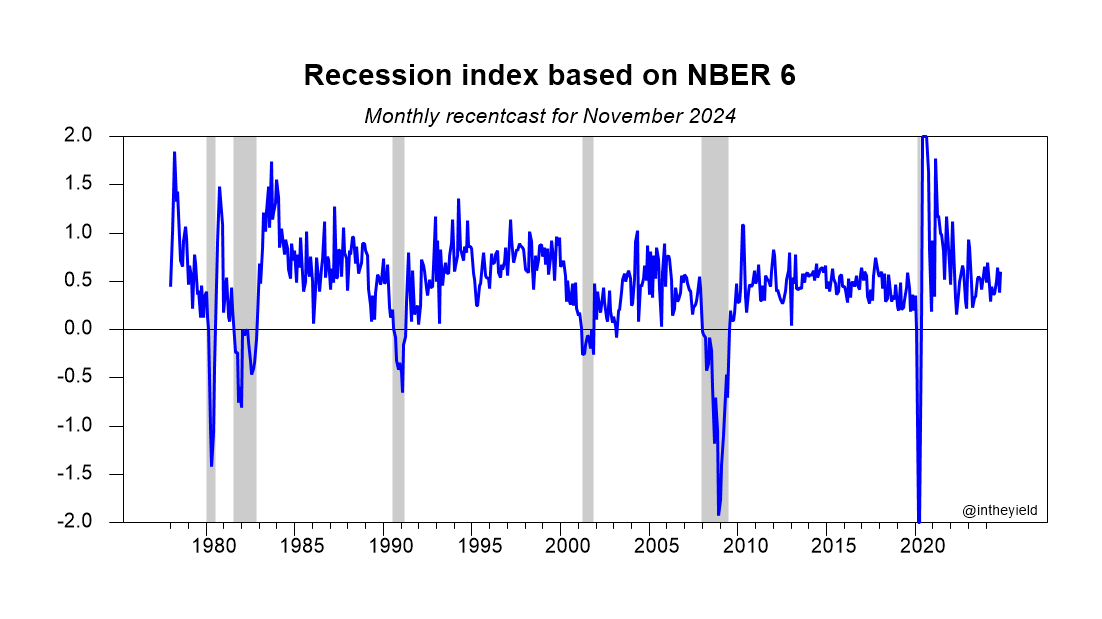
The final graph is a monthly "recentcast" that contains information from all 6 NBER variables and is calibrated to turn negative during recessions. The recentcast is available with a one-month lag relative to the employment numbers.
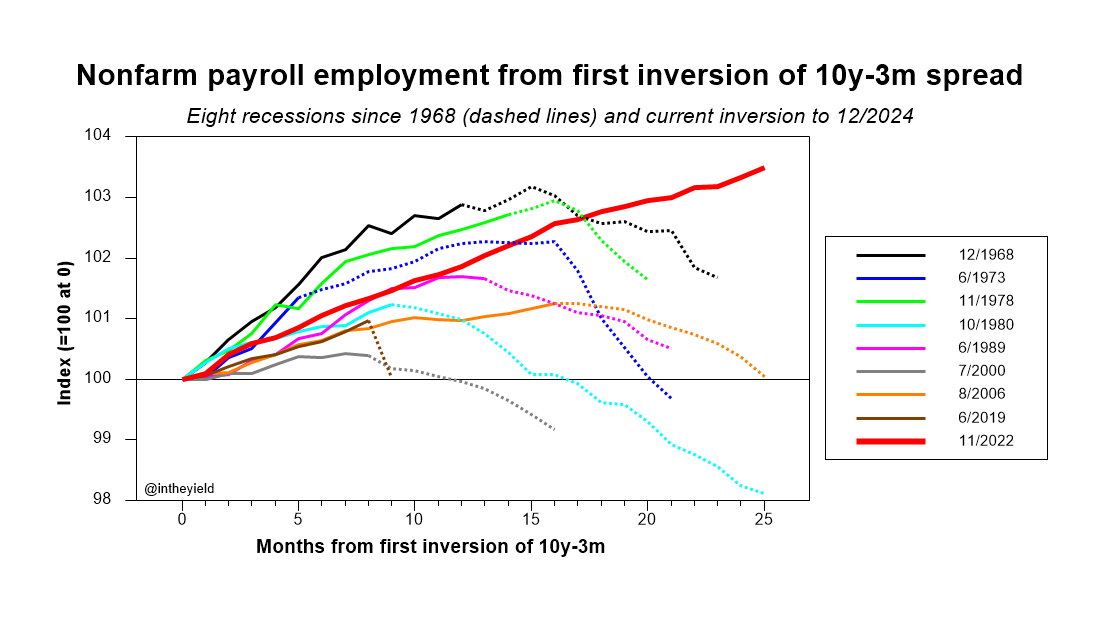
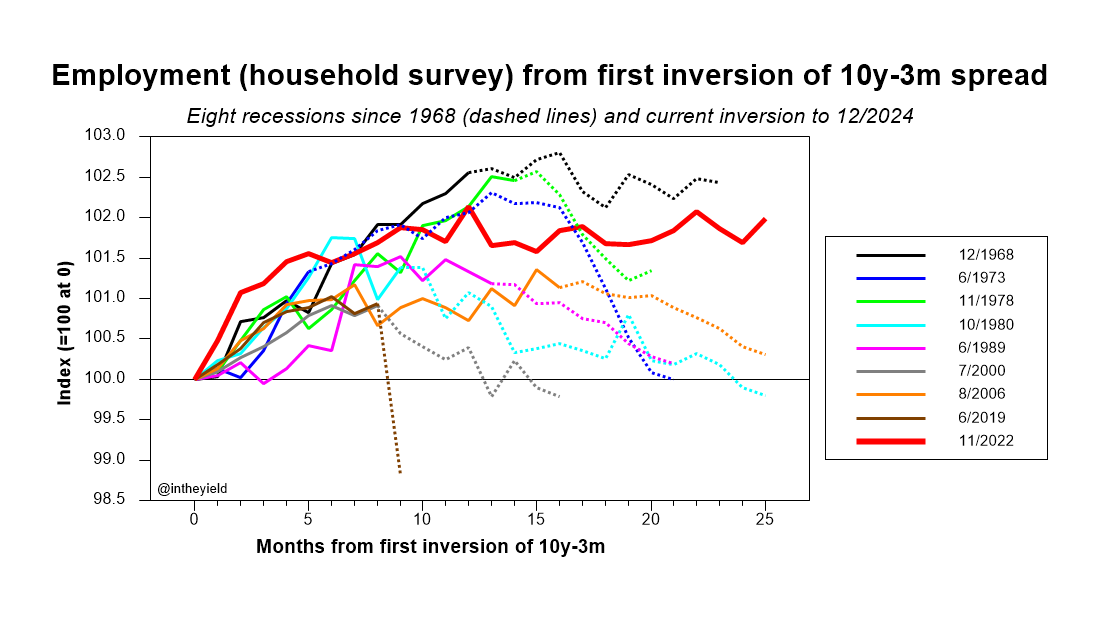
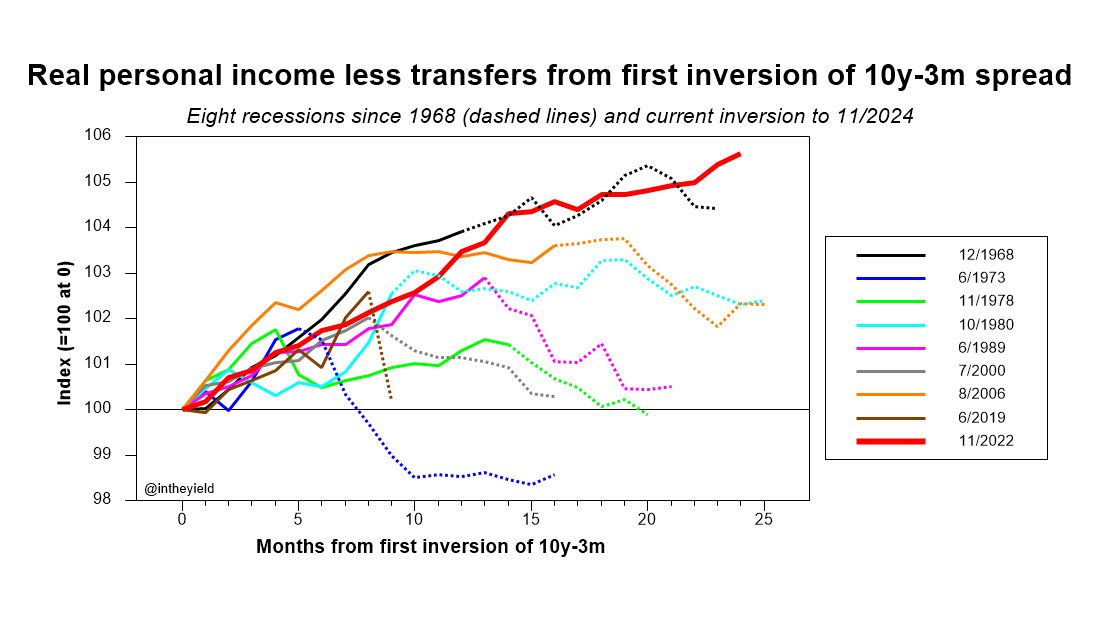
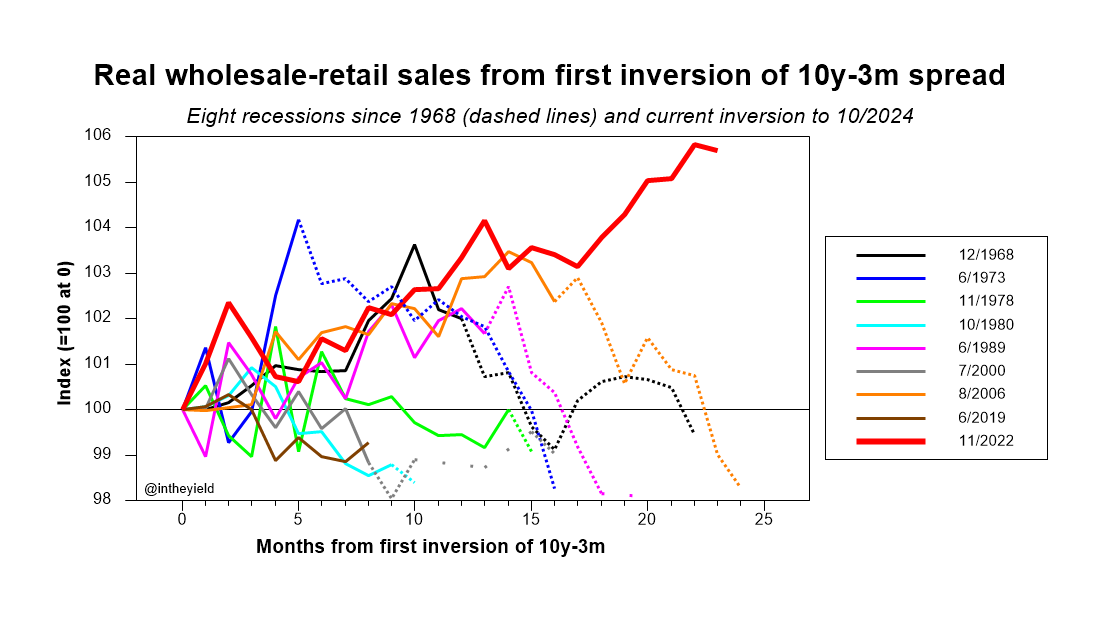
Set 1. Comparison of each of the NBER 6 with individual paths in 8 earlier inversions, 1968-2020
This set of graphs compares the path of each variable since November 2022 with its trajectory through each of the 8 earlier pre-recession inversion periods and into the subsequent recession. To plot them on the same scale, each path is indexed to 100 in the month in which the curve first inverts, which is labeled as month 0. Each path ends at the NBER peak month, which marks the start of the recession.


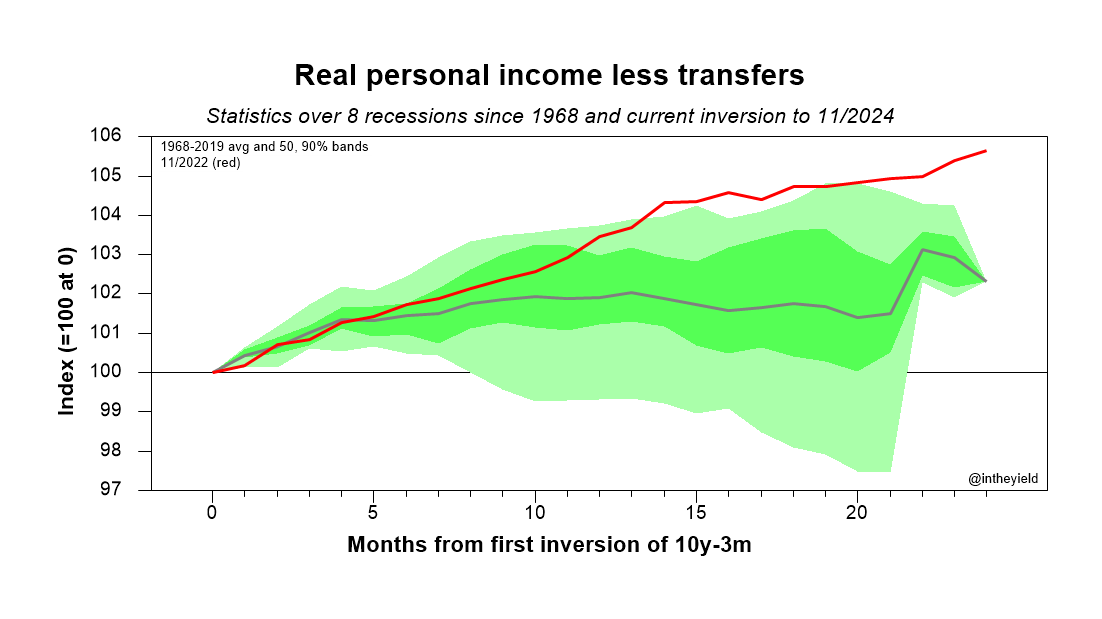
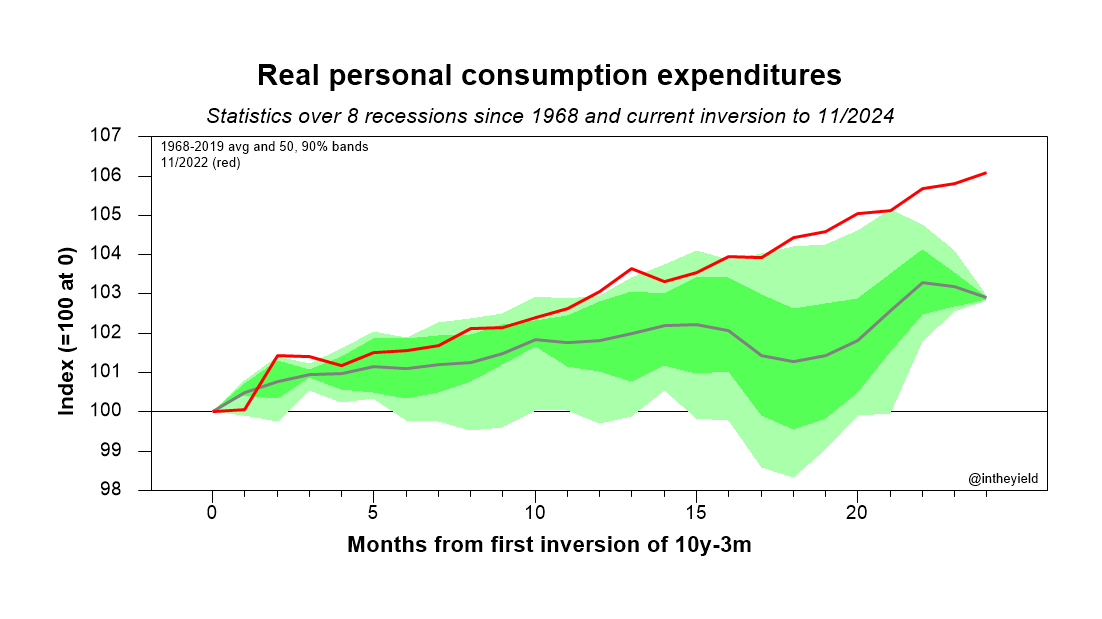
Set 2. Comparison with the average and with 50 and 90% bands for each of the NBER 6 in 7 earlier inversions, 1968-2019
To make the results easier to visualize, these 6 graphs compare the November 2022 path with statistics corresponding to the reference cases from 1968 to 2019. The graphs show the average path of the indicator and bands bounded by the 25th and 75th percentiles of cases (dark green) and by the 5th and 95th percentiles (lighter green). The 2020 recession and the preceding inversion are not included because the short and sharp drop in each of the indicators distorts the scale of the graphs. To plot all episodes on the same scale, each path is indexed to 100 in the month in which the curve first inverts, which is labeled as month 0.


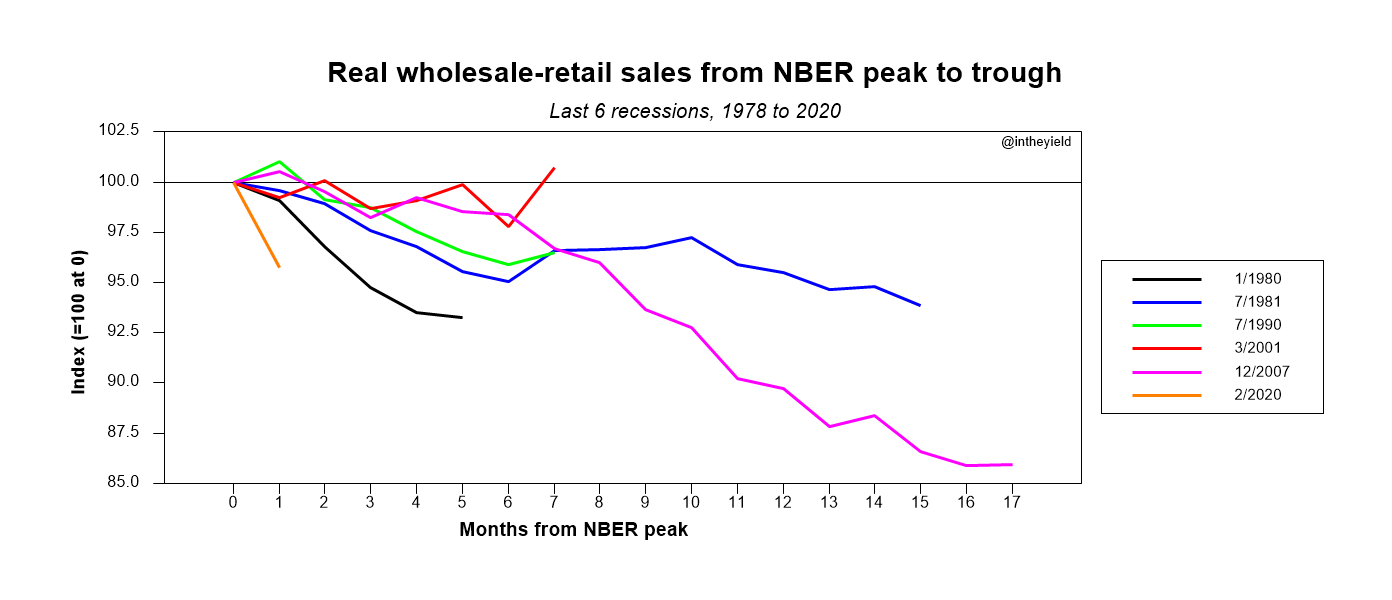
Set 3. Comparison of individual paths of each of the NBER 6 during the last 6 recessions, 1978-2020
These graphs track the NBER 6 variables from the start (peak) to the end (trough) of each recession. In this case, month 0 is the cyclical peak as determined by the NBER.
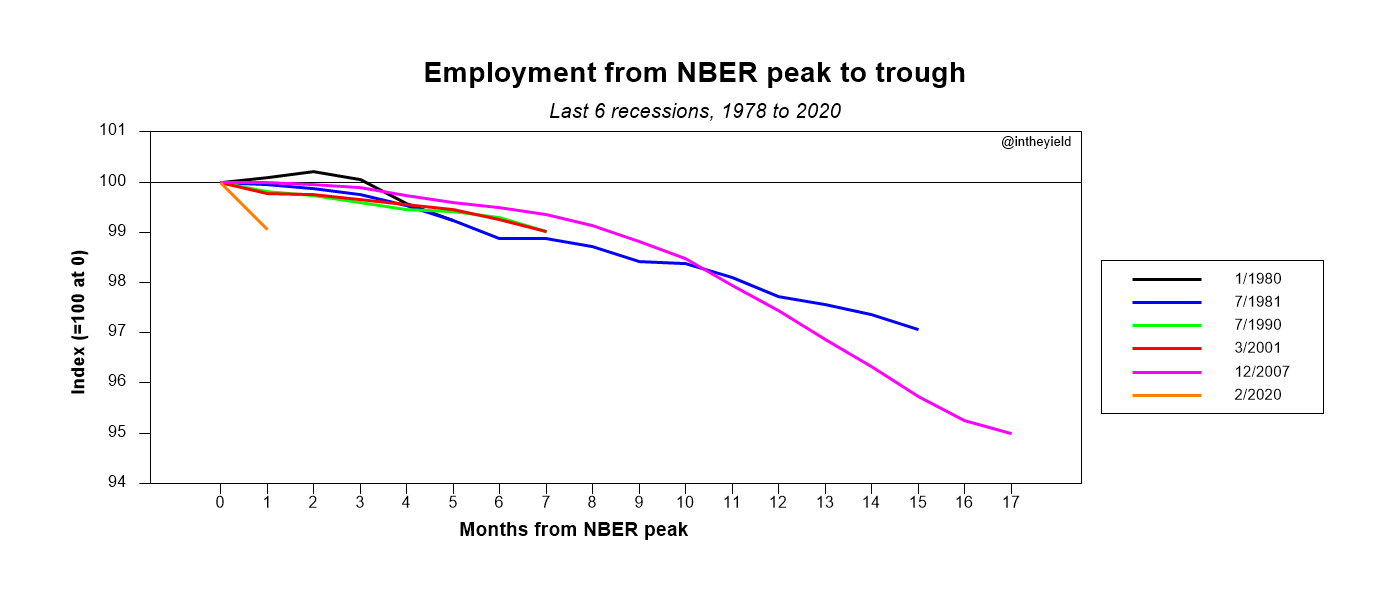


The following summary graph shows the median of each NBER 6 variable across the 6 recessions over the 17 months following a business cycle peak. The length of the period is selected to encompass observed recession lengths. Note that industrial production and sales fall sharply, whereas the others decrease more moderately. Consumption tends to hold up longest.

Set 4. Recession Recentcast: Single recession index that combines the NBER 6 variables
This index is constructed from data for all of the NBER 6 variables and is designed to turn negative during recessions. The recentcast is available at the beginning of each month, after the release of the employment situation report by the Bureau of Labor Statistics, and has a one-month lag relative to the employment numbers. The index is not a forecast. It tends to fall sharply at the start of each recession, so it can help confirm that a recession has started with a 1-2 month lag. It also rises sharply to positive levels at the end of each recession.