Probability That a Recession Will Start Within the Next 12 Months
Probability of US Recession Chart: New Calibrated Model
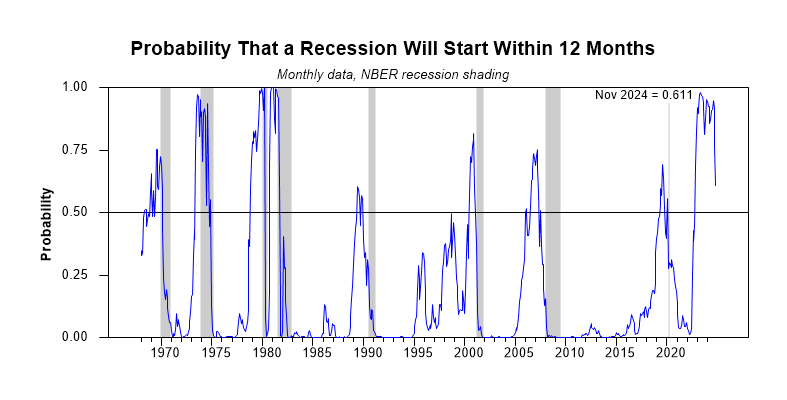
This model uses the monthly average term spread between 10-year and 3-month Treasury rates to estimate the probability that a US recession will start anywhere from one to 12 months into the future. The model is estimated here using data for the monthly NBER recession indicator from January 1968 to twelve months prior to the end of the data sample. The final year of available data is held back in recognition of the long lags in the identification of business cycle turning points by the NBER. See Discussion Paper No. 2301 for details of the model. The following graph shows the historical performance of the new model.
Discussion
Like the original model, the probability model presented in this section uses monthly observations of the 10-year minus 3-month Treasury yield spread to forecast recessions. However, the new model is optimized to make better use of the special characteristics of the recession and term spread data series and it is calibrated so as to make the results more easily interpretable.
One clear difference between the models is the definition of the event being predicted. Whereas the original model estimates the probability that the US economy will be in recession in a single future month, specifically 12 months ahead of the observed term spread, the new model calculates the probability that a US recession will start within the 12 months that follow the term spread observation. The new formulation provides more accurate forecasts of the recession event as defined, which represents a more flexible forecast horizon.
Another advantage of the optimized calibration of the new model is that the threshold level for judging that the risk of recession is severe is a probability level of 50%, which is more intuitive than the implicit benchmark level of 30% in the original model. The lower benchmark was not a serious problem for an experienced user of the original model, but the new benchmark is easier to grasp even for someone looking at this type of model for the first time. Note in the above chart that every time the probability indicates that an upcoming recession is more likely than not, a recession ensues a few months later.
Current Tracking
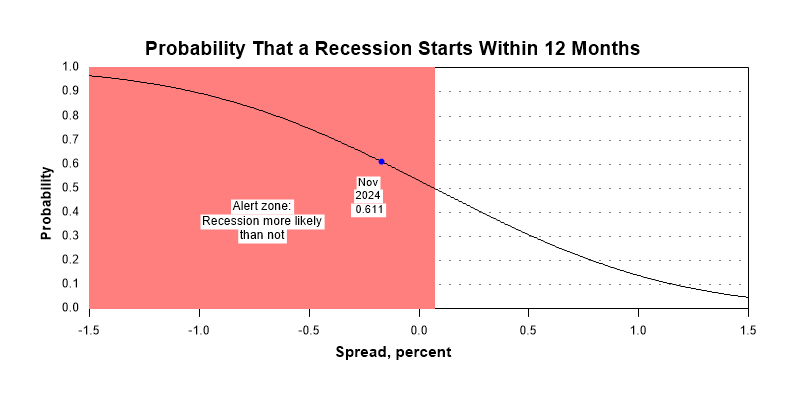
This graph shows the probability that a recession will start within the next 12 months, given the current monthly level of the yield curve spread as shown on the horizontal axis. The probability is estimated from the monthly average of the 10-year minus 3-month spread using the new calibrated model described above. Note that as the spread falls from 1.5% to 0.1%, the probability of recession rises increasingly quickly toward 50%.

