Monetary Tightening Cycles
We take a look at movements in the federal funds rate to identify periods of monetary tightening. Then we ask: When the Fed stops tightening, how can they know if they tightened enough to cause a recession? Surprisingly, the answer is quite simple.
U.S. Monetary Policy Tightening Cycles
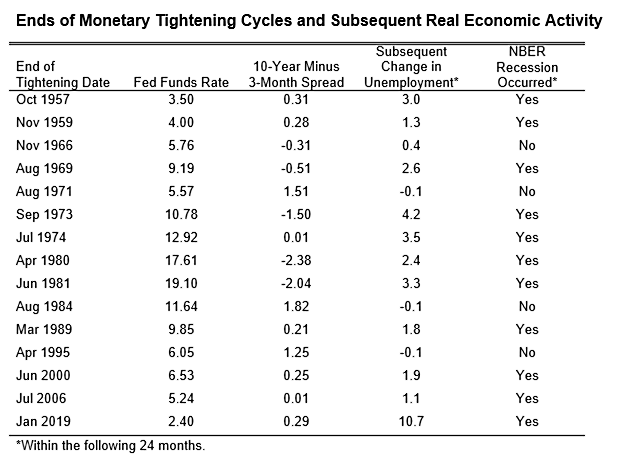
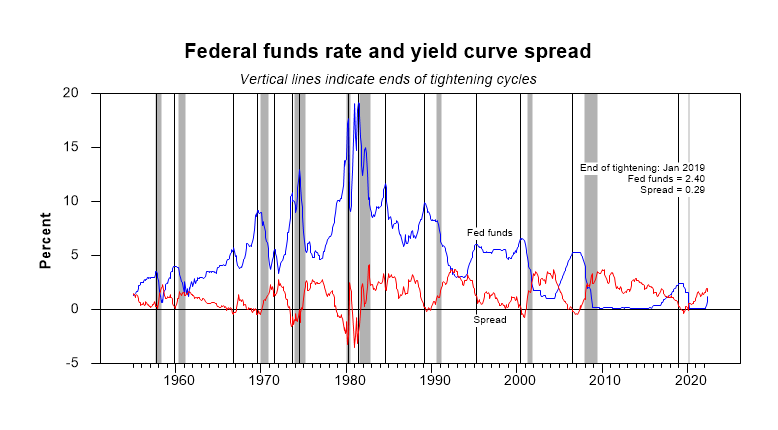
In the papers cited at the bottom of this page, we identify the ends of 14 monetary tightening cycles in the U.S. economy from 1955 to 2006 (denoted in the graph below by vertical grid lines). Ten of these cycles were followed by NBER-dated recessions (shading) and 11 were followed by increases in the unemployment rate (see table). The updated paper shows that a recession has generally followed the end of a tightening cycle if the yield curve spread is less than 0.78% in the month when tightening ends (level determined by statistical analysis). Only one case (1966) was incorrectly classified by this rule of thumb, but even in that case there was a subsequent rise in unemployment, as in all the recessions. The papers describe the methodology and provide detailed results.
Using the same methodology as in the papers, the table below updates Table 1 from the 2009 paper and identifies an additional tightening cycle ending in January 2019. At that time, the yield curve spread was well below the statistical threshold of 0.78% and tightening was followed by a large rise in unemployment and an NBER-dated recession.
References
Tobias Adrian and Arturo Estrella,
"Monetary Tightening Cycles and the Predictability of Economic Activity."
Economics Letters, May 2008
Tobias Adrian and Arturo Estrella, "Monetary Tightening Cycles and the Predictability of Economic Activity." Federal Reserve Bank of New York Staff Report No. 397, October 2009 (Update of journal article)